Description:
Liveline is a React charting library that renders real-time animated data directly to a canvas element. It handles line and candlestick modes at 60fps with zero CSS imports.
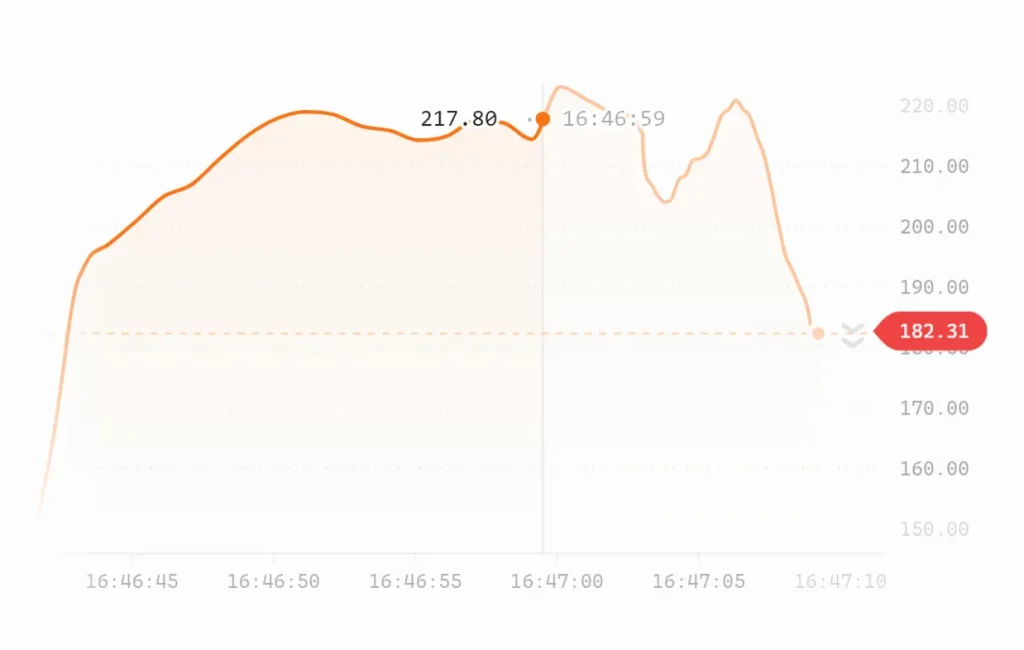
The component fills its parent container, uses Fritsch-Carlson monotone splines for smooth curves, and derives its entire color palette from a single accent color plus theme setting.
The library focuses on live data streams. It interpolates values between updates, pauses rendering when the tab hides, and tracks container size with ResizeObserver. No per-frame layout reads occur.
Features
- ⚡ Canvas Renderer: Single
<canvas>element handles all drawing. No DOM nodes per data point. - 📈 Dual Modes: Line chart or candlestick chart with OHLC bodies, wicks, and bull/bear coloring.
- 🎨 Theme System: Full palette derives from a
colorprop andlight/darktheme. Grid, badge, and gradients adapt automatically. - 🔄 Smooth Interpolation: Frame-rate-independent linear interpolation on value, Y-axis range, badge color, and scrub opacity.
- 📊 Candlestick Morph:
lineModeprop smoothly collapses candle bodies to close price and extends a line view. Coordinated alpha crossfade animates the transition. - 🕒 Time Windows: Built‑in buttons for time horizons (5m, 15m, 1h, etc.) with
onWindowChangecallback. - 🔍 Crosshair Scrub: Hover to see crosshair with tooltip.
onHoverreturns point data and canvas coordinates. - 📦 Order Book Overlay: Render bid/ask depth as particles alongside the main chart when
orderbookprop is provided. - ⏳ Loading State:
loadingprop triggers a breathing line animation that morphs into the actual chart when data arrives. - ⏸️ Pause Support:
pausedsmoothly freezes scrolling; resume catches up to real time. - 🧩 Minimal Empty State: Shows “No data to display” when data is absent and not loading.
Use Cases
- Crypto Trading Dashboard: Live price charts with candlestick view, momentum indicators, and order book depth.
- Financial Terminal: Multiple time windows, line/candle toggle, and precise value formatting for currency.
- Server Monitoring: Real‑time metric streams with pause/resume when tabs become inactive.
- Trading Interface with Order Book: Combine price action with bid/ask depth visualization and particle effects.
How to Use It
Installation
pnpm add liveline
# or
npm install liveline
# or
yarn add liveline
Basic Line Chart with Badge
import { useState } from 'react'
import { Liveline } from 'liveline'
import type { LivelinePoint } from 'liveline'
function LiveChart() {
  const [data, setData] = useState<LivelinePoint[]>([])
  const [value, setValue] = useState(0)
  // Connect to WebSocket or polling to update data and value
  return (
    <div style={{ height: 300, width: '100%' }}>
      <Liveline
        data={data}
        value={value}
        color="#3b82f6"
        theme="dark"
      />
    </div>
  )
}
The component fills its container. Set a fixed height or flex height on the parent element.
Candlestick Mode with Time Windows
import { useState } from 'react'
import { Liveline } from 'liveline'
function CandleChart() {
  const [candles, setCandles] = useState([])
  const [liveCandle, setLiveCandle] = useState(null)
  const [ticks, setTicks] = useState([])
  const [latestTick, setLatestTick] = useState(0)
  return (
    <div style={{ height: 400 }}>
      <Liveline
        mode="candle"
        data={ticks}
        value={latestTick}
        candles={candles}
        candleWidth={60}
        liveCandle={liveCandle}
        color="#f7931a"
        formatValue={(v) => `$${v.toFixed(2)}`}
        windows={[
          { label: '5m', secs: 300 },
          { label: '15m', secs: 900 },
          { label: '1h', secs: 3600 },
        ]}
      />
    </div>
  )
}
Pass committed OHLC bars as candles and the in‑progress bar as liveCandle. candleWidth sets the time bucket in seconds.
Candlestick with Line Mode Toggle
function ChartWithToggle() {
  const [showLine, setShowLine] = useState(false)
  return (
    <Liveline
      mode="candle"
      data={ticks}
      value={latestTick}
      candles={candles}
      candleWidth={60}
      liveCandle={liveCandle}
      lineMode={showLine}
      lineData={ticks}
      lineValue={latestTick}
      onModeChange={(mode) => setShowLine(mode === 'line')}
      color="#f7931a"
    />
  )
}
The onModeChange prop renders a built‑in line/candle toggle next to the time window buttons.
Crypto Dashboard with Momentum and Degen Mode
<Liveline
  data={data}
  value={value}
  color="#f7931a"
  exaggerate
  degen
  showValue
  valueMomentumColor
  formatValue={(v) => `$${v.toLocaleString('en-US', { minimumFractionDigits: 2 })}`}
/>
exaggerate scales the Y‑axis to fill the chart height with small moves. degen adds burst particles and chart shake on momentum swings. showValue renders a large live value overlay updated at 60fps without re‑renders.
Dashboard with Large Value Display and No Badge
<Liveline
  data={data}
  value={value}
  badge={false}
  showValue
  windows={[
    { label: '15s', secs: 15 },
    { label: '30s', secs: 30 },
    { label: '2m', secs: 120 },
    { label: '5m', secs: 300 },
  ]}
  onWindowChange={(secs) => console.log('window changed:', secs)}
/>
Loading and Paused States
<Liveline
  data={data}
  value={value}
  loading={!webSocketConnected}
  paused={!document.hasFocus()}
/>
When loading becomes false and data exists, the breathing line morphs into the actual chart shape.
Orderbook Integration
<Liveline
  data={data}
  value={value}
  color="#f7931a"
  orderbook={{
    bids: [[100, 2.5], [99, 8]],
    asks: [[101, 3], [102, 6]]
  }}
  degen
  showValue
/>
API Reference
Data Props
| Prop | Type | Default | Description |
|---|---|---|---|
data | LivelinePoint[] | required | Array of { time: number, value: number } points. Time in Unix seconds. |
value | number | required | Latest value. The library interpolates smoothly to this value. |
Appearance Props
| Prop | Type | Default | Description |
|---|---|---|---|
theme | 'light' | 'dark' | 'dark' | Base color scheme. |
color | string | '#3b82f6' | Accent color. The entire palette derives from this. |
grid | boolean | true | Show Y‑axis grid lines and labels. |
badge | boolean | true | Show value pill that tracks the chart tip. |
badgeVariant | 'default' | 'minimal' | 'default' | Badge style. minimal uses white with grey text. |
badgeTail | boolean | true | Show pointed tail on the badge. |
fill | boolean | true | Fill gradient under the curve. |
pulse | boolean | true | Animated pulsing ring on the live dot. |
Feature Props
| Prop | Type | Default | Description |
|---|---|---|---|
momentum | boolean | 'up' | 'down' | 'flat' | true | Dot glow and arrows. true auto‑detects direction. |
scrub | boolean | true | Enable crosshair on hover. |
exaggerate | boolean | false | Scale Y‑axis so small moves fill the chart height. |
showValue | boolean | false | Render large live value overlay. Updates at 60fps without React re‑renders. |
valueMomentumColor | boolean | false | Color the large value text green (up) or red (down) based on momentum. |
degen | boolean | object | false | Enable burst particles and chart shake on momentum swings. |
Candlestick Props
| Prop | Type | Default | Description |
|---|---|---|---|
mode | 'line' | 'candle' | 'line' | Chart type. |
candles | CandlePoint[] | — | OHLC data { time, open, high, low, close }. |
candleWidth | number | — | Seconds per candle. |
liveCandle | CandlePoint | — | Current in‑progress candle. Update this every tick. |
lineMode | boolean | false | Smoothly morph candles into a line view. |
lineData | LivelinePoint[] | — | Tick‑level data for high density during line mode. |
lineValue | number | — | Current tick value for line mode. |
onModeChange | (mode) => void | — | Callback for the built‑in line/candle toggle. |
State Props
| Prop | Type | Default | Description |
|---|---|---|---|
loading | boolean | false | Show breathing line animation. Morphs to chart when data arrives. |
paused | boolean | false | Freeze chart scrolling. Resuming catches up to real time. |
emptyText | string | 'No data to display' | Text shown when data is empty and not loading. |
Time Props
| Prop | Type | Default | Description |
|---|---|---|---|
window | number | 30 | Visible time window in seconds. |
windows | { label: string, secs: number }[] | — | Array of time horizon buttons. |
onWindowChange | (secs) => void | — | Callback when a window button is clicked. |
windowStyle | 'default' | 'rounded' | 'text' | 'default' | Visual style for window buttons. |
Crosshair Props
| Prop | Type | Default | Description |
|---|---|---|---|
tooltipY | number | 14 | Vertical offset for the crosshair tooltip text. |
tooltipOutline | boolean | true | Stroke outline on tooltip text for readability. |
Orderbook Prop
| Prop | Type | Default | Description |
|---|---|---|---|
orderbook | { bids: [number, number][], asks: [number, number][] } | — | Bid/ask depth stream. Each entry is [price, size]. |
Advanced Props
| Prop | Type | Default | Description |
|---|---|---|---|
referenceLine | { value: number, label?: string } | — | Horizontal reference line. |
formatValue | (v: number) => string | v.toFixed(2) | Formatter for value labels. |
formatTime | (t: number) => string | HH:MM:SS | Formatter for time axis. |
lerpSpeed | number | 0.08 | Interpolation speed between 0 and 1. |
padding | { top, right, bottom, left } | { top: 12, right: 80, bottom: 28, left: 12 } | Chart padding override. |
onHover | (point | null) => void | — | Hover callback. Point includes { time, value, x, y }. |
cursor | string | 'crosshair' | CSS cursor when hovering the canvas. |
className | string | — | CSS class for the container div. |
style | CSSProperties | — | Inline styles for the container div. |
FAQs
Q: How do I prevent the chart from collapsing to zero height?
A: The component inherits its dimensions from the parent container. You must apply a fixed height or specific flexbox constraints to the wrapping element.
Q: Does the library support multiple data series on the same chart?
A: The current API focuses on a single primary data stream. You cannot plot multiple overlapping line series natively.
Q: How does the component handle missing data points?
A: The Fritsch-Carlson spline algorithm connects existing points continuously. You activate the loading prop to display a breathing animation if the data stream drops entirely.
Q: How do I connect Liveline to a WebSocket stream?
A: Update the data array and value prop each time a new message arrives. Append new points to the data array. The chart rerenders efficiently via canvas.
Q: Does Liveline work with server‑side rendering?
A: Yes. The component renders a container div on the server. Canvas drawing only runs on the client after hydration.
Q: Can I use custom colors beyond the single accent color?
A: The color system derives everything from the color prop and theme. For full control, you can override specific styles using the className or style props on the container.


